


A Coordinated Strategy to Develop and Distribute Infographics Addressing COVID-19 Vaccine Hesitancy and Misinformation
University of Chicago Medicine
"IMPACT's strategy allowed for amplification of health care worker voices through social media to address vaccine hesitancy and improve vaccine access for at-risk communities..."
Visual communication strategies are becoming increasingly prevalent for conveying information to health professionals as well as to the general public. Early in the COVID-19 pandemic, health professionals recognised the potential of social media for rapid knowledge dissemination using infographics. This paper describes the approach of a coalition of health professionals to developing infographics about COVID-19 vaccines and the reach and engagement of those infographics when shared through social media.
The grassroots coalition whose work is profiled in the paper was formed in March 2020 by a group of physicians in Chicago, Illinois, United States (US). The mission of the Illinois Medical Professionals Action Collaborative Team (IMPACT) is to "activate change that maximally supports Illinois health care workers and the communities they serve by promoting improved quality of health care, personal welfare, and patient and provider safety. Supporting health care workers by definition includes supporting their families, their patients, their communities, and the public good." In addition to disseminating statements and open letters to public officials, the coalition collaborates with partners to increase the reach of messaging, shares stories through the IMPACT blog and IMPACTful chats, and develops infographics to combat misinformation.
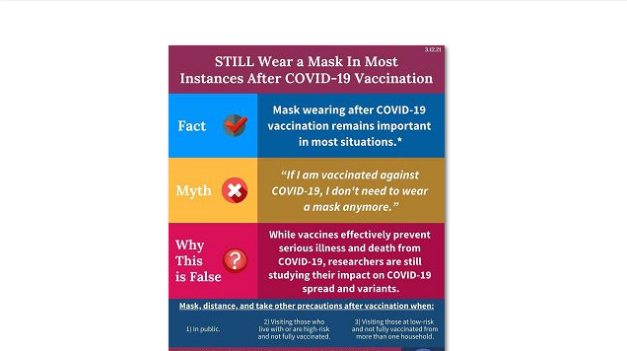
The infographics were created by a core team within the coalition following a stepwise approach. They began by identifying the purpose, intended audience, key message to be conveyed, information needed to provide that message, relevant symbols or graphics, and sources for the information. Next, the team discerned ease of readability, synthesised the story, determined composition, including colour palette and typography, and selected title, subtitle, and images. Each infographic underwent a multistep review process, readability evaluation, and translation into Spanish. Infographics were then shared on Twitter, Instagram, Facebook, and LinkedIn. Hashtags (e.g., #ThisIsOurShot) were used, and IMPACT members, partners, and the coalition itself were tagged to encourage further amplification.
For the purpose of this study, all infographics posted to the IMPACT website between March 29 2020 and June 16 2020 were reviewed by two infographics core team members and an additional IMPACT member to determine if they provided information about COVID-19 vaccines. Each infographic was then categorised as one of the following styles: myth debunkers, COVID-19 vaccine series, or other.
Analytics for each infographic were retrieved on June 23 2021 from Twitter, Instagram, and Facebook to determine overall reach, impressions, and engagement on each platform. Combined, the infographics had a total reach of 238,430. The five COVID-19 vaccine series, six myth busters, and four "other" had a total reach of 86,809, 80,065, and 71,556, respectively. When comparing the three groups, no single infographic type consistently performed higher than the others.
All infographics had greater outreach, impressions, and engagement on Twitter than they did on other platforms. One of the reasons could be the use of an amplifier, or private group direct message, which included IMPACT members so they could quickly find tweets from IMPACT they may have missed on their feed. Shares and retweets from these personal accounts with extensive reach may explain the study's findings about Twitter, specifically. (In addition, this amplifier strategy allowed for rapid direct messaging to the group about new stories and other content that might be appropriate to address with future infographics, IMPACTful chats, or blog posts.)
Research indicates that nearly one in four physicians who use social media report being personally attacked or harassed and that these attacks are frequently tied to advocacy work, including vaccine advocacy. The sharing of infographics first through IMPACT social media accounts rather than by individual members may have helped limit negative or threatening engagement.
Although it is not possible to conclude, on the basis of this study alone, that the IMPACT infographics have had an impact on vaccine hesitancy, individual healthcare workers both within and outside the coalition said they have used the infographics in conversations with patients and found them to be effective. In addition, the IMPACT team has used some of the same images and messaging in presentations to local schools, who provided positive feedback after those sessions.
"Future directions for research on the role of infographics in combating COVID-19 vaccine hesitancy might include patient surveys to determine a change in perception of vaccines before and after viewing an infographic, patient surveys to determine whether information presented in a visual format influenced their decision to receive a vaccine, health care worker surveys to evaluate whether they found infographics helpful to include in their counseling when encountering patients with vaccine hesitancy, or a host of other questions."
In conclusion, based on the experience IMPACT had with infographics as detailed in this study, the coalition anticipates that they will continue to use them in the future for both COVID-19 vaccine information and other public health concerns.
Journal of the American Pharmacists Association https://doi.org/10.1016/j.japh.2021.08.016. Image credit: IMPACT
- Log in to post comments